Top 5 company numbers for product managers to follow

Last week I wrote that PMs are responsible for growth. There are 7 levers of growth at your disposal. But in order to keep track of progress, you need to measure the business growth.
PMs have their own metrics like activation, adoption, usage etc. Those are important to follow the products progress. However, you need to be able to see how it is impacting the business numbers.
You may argue that why should company numbers matter to your role. Should a PM not be focused on PM specific metrics? Yes and No.
Yes, you need to be religious about your own product metrics. Your product work should influence the product metrics.
But how can you be sure if this is helping the business. You may move the product numbers but if the company numbers don’t move than there is something wrong. Either your product metrics are not aligned or some other factor is impacting business.
Which business metrics should you follow?
At every company, that I worked at, I followed a few key company level numbers.
Based on how today’s numbers are moving (or not), you can influence downstream numbers, say 6 months and beyond, by implementing the appropriate product strategy.
How do you that?
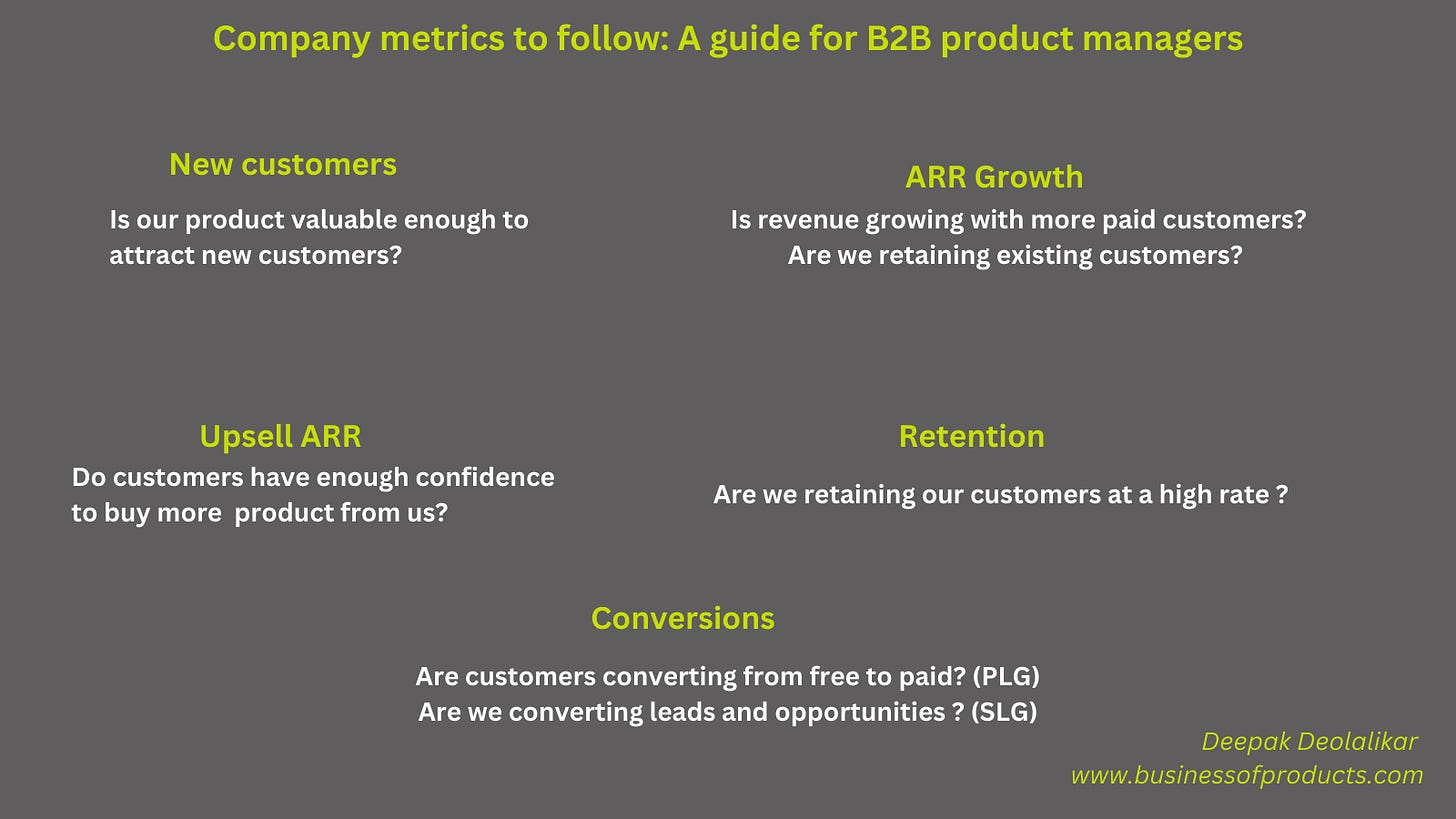
First, here are key metrics you should follow each month or quarter. I am restricting my discussion to B2B.
New customers/ARR added
ARR/MRR Growth
Upsell ARR
Retention (Gross/Net)
Conversions

How do you interpret these metrics, and more importantly how do you react as a product manager if they are not making progress?
New customers/ARR added
This metric tells how many net new customers were added in the previous quarter. This is commonly called new logos. It can be number of customers as well as ARR added.
An increasing number shows that customers are interested in leveraging your product. What you want to watch is growth rate. Let’s say you are adding 10% new customers in one quarter, 15% the next, 20% the following and so on, then you have a very good growth trajectory and that you are on to market leadership. Your product is working and customers are responding to your value proposition.
If the growth is flat, then something is not working out. Maybe the demand gen is not generating enough leads. Or perhaps the sales team is not able to close the deals. This could be due to execution issues or messaging issues. From a product point of view, you might want to confirm if you are not attracting new customers because of product limitations. Let’s say your product caters to a specific niche but there is a limit to the growth in that niche. Now you may want to consider expanding out of the niche which could mean product changes.
A decreasing number is a cause for concern for sales, marketing and product. It could mean sales and marketing is not working out. It could also mean the product is not meeting the needs and somehow customers are not placing your product in their consideration list. A quick check on the win/loss analysis can ascertain the cause of decreasing growth.
By the way, product can rarely influence short term sales. In B2B, it can be 6 months or over when product decisions can translate into sales.
ARR (Annual Recurring Revenue) Growth
This metric tells you how the overall ARR is growing. ARR can come from new sales, existing customers, new up sells and cross sells, and retention. You want the ARR to keep growing.
This is the overall ARR. ARR can grow because of :
High retention
Existing customers buying more (upsell and cross sell, upgrades)
A descreasing ARR could mean that retention is low (high churn) or customers are not buying more. You will need to isolate the core reason because the exact action will depend on the root cause.
Upsell ARR
This metric includes new ARR added but by existing customers. This can happen when customers buy more users, or they buy a new product or addons. We are only interested in recurring revenue that comes from subscription service. We are not interested in one off sales such as professional services or training fee.
In fact if professional services is growing as a % of total revenue, you might question if your company is turning into a services business. In the early stages of a startup, it’s common. Not a bad thing per se as it gives early cash, but something not desirable for the long haul.
Retention Gross/Net
Retention is the holy grail of SAAS businesses. You want to closely monitor retention. This tells how you satisfied your customers are with the product.
For definition :
Gross retention —> number of customers retained and want to keep using your product e.g. Let’s say we start Jan with 100 customers of $ 100K ARR We lost 15 during the year, say $ 15K ARR ARR in Dec = $100K – $ 15K = $ 85K
—> gross retention = 85% or churn = 15%
Net Retention —> number of customers retained and buying more by adding seats, adding new product offers e.g.
Let’s say we start Jan with 100 customers of $ 100K ARR We lost 15 during the year, say $ 15K ARR
Existing customers added new seats worth say $ 25K ARR in Dec = $100K – $ 15K + $ 25K = $ 110K
—> net retention = 110%
A high gross retention means customers are happy and want to keep using your product. A lower gross retention means customers are not finding the product useful. This is where product management need to step in and analysis the root causes.
A high net retention means customers are happy and want to keep not just using but expanding your product in their organization. This is a good sign that your product and messaging both are working.
Retention also helps profitability as it is cheaper to retain an existing customer vs acquiring a new customer
Conversions
Conversion from marketing to actual sale. A growing conversion means that your marketing and value proposition is working
A lower conversion could happen due to many factors. Key ones are –
heavy competition
lower demand
value not clear
not targeting the right channel
price
As a product manager, your job is to ensure the right value propositions are articulated well in all marketing activities. Conversion can also be impacted if competitors are stealing your business. In which case, you need to figure out how to handle the competition.
There are a few other metrics that you may want to track especially in startup stages – like profit or EBITDA (Earnings before interest, taxes, depreciation and amortization) or cash flow.
But start with the top 5 metrics. This will allow you to be a more purposeful product manager and work on building those features or products that will move these needles.
Where do you find these numbers? Most CEOs will share them in the quarterly all hands. If not, ask finance to provide you these numbers. These should not be a secret.
OK, great.
You are watching these numbers like a hawk. What do you do now? You will need to do some investigation on why the numbers are not progressing. This is where your product usage data and CRM data is going to be needed.
How you should organize your data is a topic for another article.
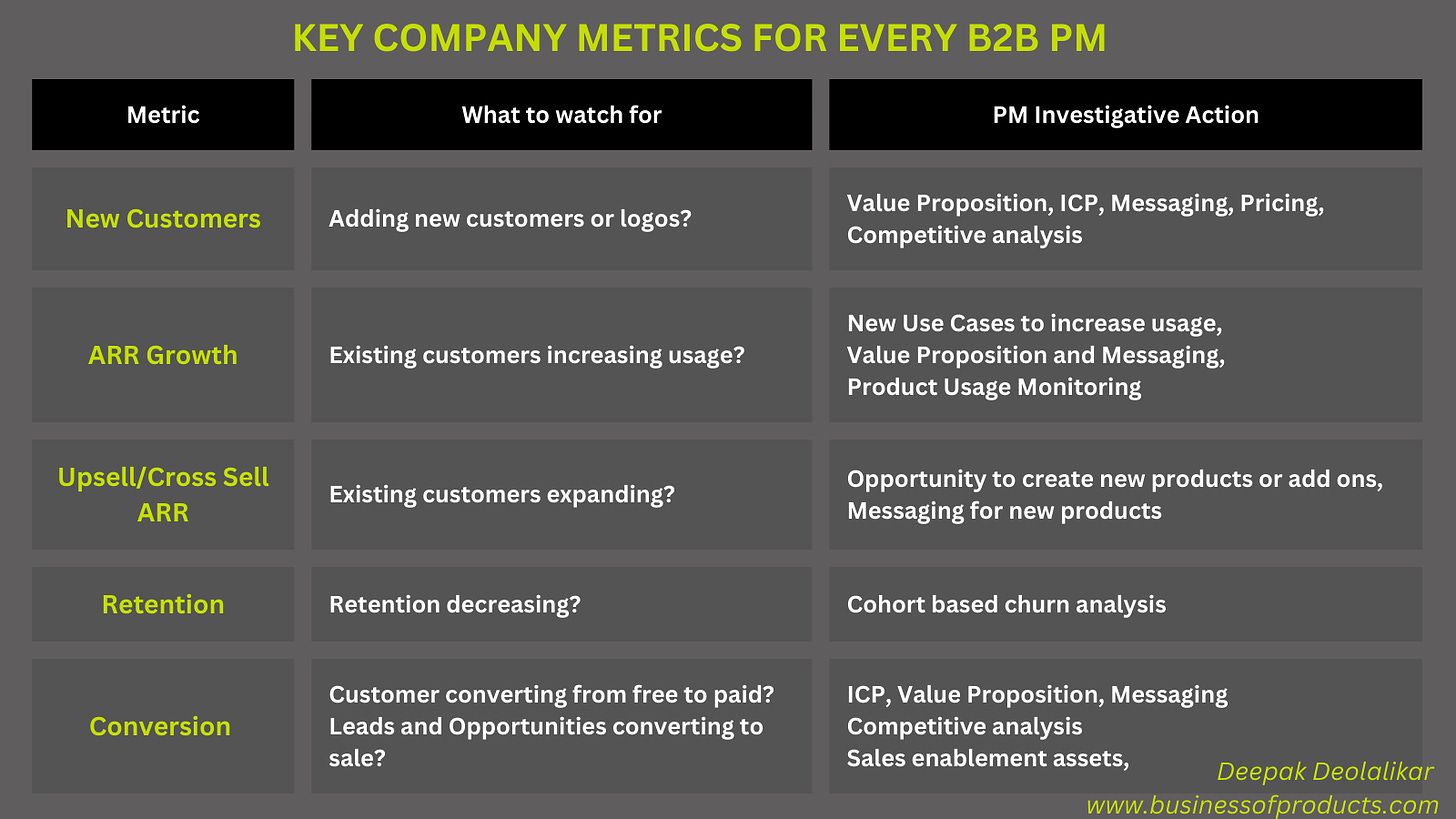
Here are some specific actions you can take as a PM when following these metrics.

Note: The above numbers may also be impacted due to sales and marketing execution. Your goal is to look at the overall numbers and determine if there is anything you can do from a product perspective to help move the numbers e.g. fine tune the value proposition, build features to handle objections, create a better demo.
Sometimes it is not straightforward to determine if this is on execution issue or a product issue. My suggestions is to keep yourself involved.

